
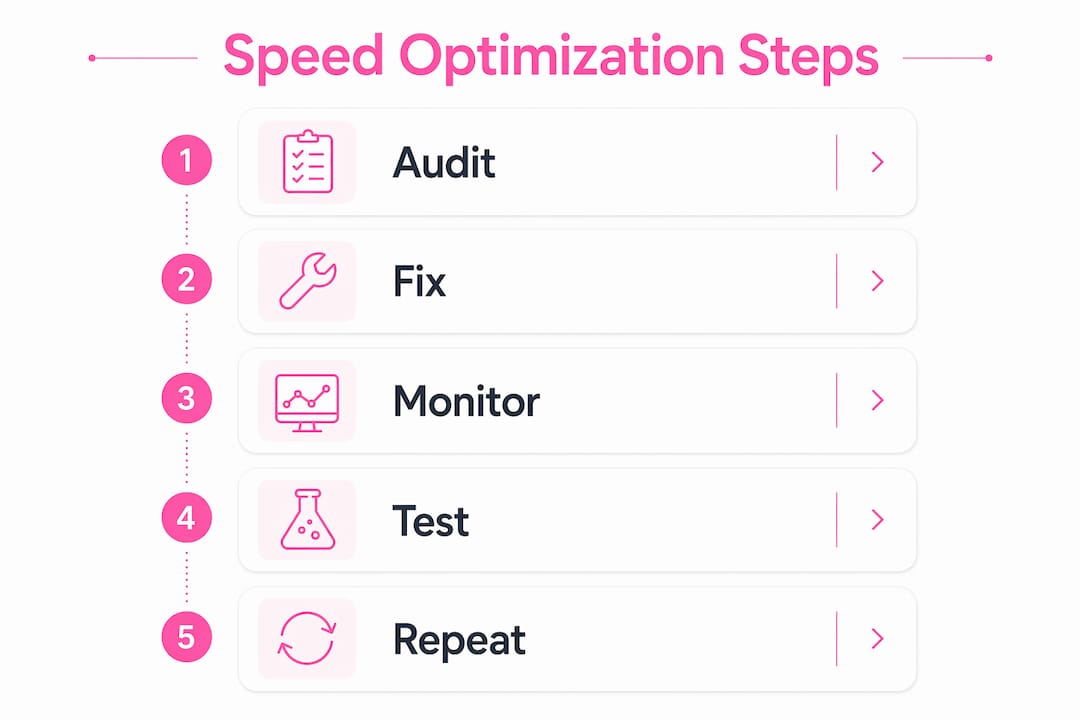
Website speed optimization ongoing is the continuous practice of auditing, improving, and monitoring your site's load times to maintain peak performance as your content and technology evolve. A one-time fix is never enough. New plugins, content updates, and third-party scripts reintroduce slowdowns even after you have already improved performance. Tools like Google Lighthouse, WebPageTest, Chrome User Experience Report (CrUX), and HubSpot Website Grader are the foundation of any serious ongoing monitoring program. The sites that stay fast are the ones treated as a living system, not a finished product.
What does website speed optimization ongoing actually mean?
Ongoing website speed optimization is an operational discipline, not a project with a start and end date. Every significant change to your site, whether that is a new plugin, a content update, or a third-party script, is a potential regression trigger. Re-testing after every change is the only reliable way to catch problems before they affect real users.
The discipline combines two distinct types of measurement:
- Lab testing uses tools like Lighthouse and WebPageTest to simulate page loads in controlled conditions. These give you fast, repeatable diagnostics.
- Field monitoring uses CrUX and Real User Monitoring (RUM) to capture what actual visitors experience on real devices and networks.
Neither approach alone is sufficient. Lab scores can look great while real users on low-end Android devices still experience slow loads. Field data confirms whether your fixes actually worked in production.
Neglecting continuous monitoring produces three predictable outcomes. First, performance regressions accumulate silently. Second, user experience degrades, and visitors bounce within seconds when load times climb. Third, Google's Core Web Vitals signals worsen, which directly affects your search rankings. Google Search Console's Core Web Vitals report consolidates this field data, and INP replaced FID in 2024, meaning responsiveness beyond the first interaction is now a ranking factor you must monitor continuously.
Pro Tip: Set a calendar reminder to run a full Lighthouse audit every time your development team ships a significant update. Treat it the same way you treat a post-deployment smoke test.
Understanding why site speed affects SEO rankings helps you make the business case for ongoing investment in this discipline.
Which tools work best for continuous speed testing?
Choosing the right combination of tools is the most important decision in any ongoing site speed analysis program. No single tool covers every scenario.
| Tool | Type | Best Use Case | Key Limitation |
|---|---|---|---|
| Lighthouse | Lab | Fast structural diagnosis, CI/CD integration | Simulated, not real user data |
| WebPageTest | Lab | Waterfall charts, video-based speed indexing | Slower to run, manual setup |
| CrUX | Field | Real user Core Web Vitals at scale | 28-day rolling average, no real-time |
| RUM (Real User Monitoring) | Field | Live session data, device and network breakdown | Requires custom implementation |
| Google Search Console | Field | SEO-linked Core Web Vitals reporting | Aggregated, not page-level detail |
Lighthouse provides fast structural diagnosis while WebPageTest delivers granular waterfall details and video-based speed indexing. Using both together accelerates root cause identification when a regression appears. CrUX and RUM then confirm whether the fix translated into real-world gains.

The most advanced teams integrate performance budgets directly into their CI/CD pipelines. A performance budget sets a maximum threshold for metrics like Largest Contentful Paint (LCP) or Total Blocking Time (TBT). When a code change breaches the budget, the build fails automatically. This shifts the team from reactive to preventive. Problems are caught before they reach production, not after users have already experienced them.
Pro Tip: Run multiple Lighthouse audits per build and use the median score rather than a single result. Median values from repeated audits reduce test noise and make your build failure triggers far more reliable.
Chrome is also expanding its measurement capabilities. Soft-navigation metrics and new APIs released in april 2026 enable more precise SPA performance monitoring, which matters for any site using React, Vue, or similar frameworks with dynamic content rendering.
How to build an ongoing optimization workflow
A repeatable workflow removes guesswork and keeps your team aligned. The process below works for both small business owners managing their own sites and digital marketing teams overseeing multiple properties.
-
Establish a baseline. Run Lighthouse and WebPageTest on your five most important pages. Record LCP, TBT, Cumulative Layout Shift (CLS), and INP scores. This baseline is your reference point for every future comparison.
-
Prioritize fixes by impact. Not all issues carry equal weight. Address these in order:
- Unoptimized images (convert to WebP, apply lazy-load below the fold)
- Slow server response times (upgrade hosting, enable HTTP/2, configure a CDN)
- Render-blocking scripts (defer non-critical JavaScript, minify CSS)
- Web font loading (use font-display: swap, self-host critical fonts)
-
Implement and test in a staging environment. Never push untested changes to production. Run Lighthouse on the staging build and compare against your baseline before deploying.
-
Deploy and verify with field data. After deployment, monitor CrUX and your RUM dashboard for 48–72 hours. Real user monitoring combined with CrUX is the only reliable way to confirm that lab improvements translated into real user gains.
-
Set performance budgets in your CI/CD pipeline. Tools like Lighthouse CI, SpeedCurve, and Calibre can automate this step. Define thresholds and configure the pipeline to block deploys that breach them.
-
Schedule regular reviews. Run a full audit monthly at minimum. Run an additional audit after any major content push, plugin update, or third-party script addition.
Common pitfalls to avoid:
- Lazy-loading above-the-fold images, which delays the LCP element and hurts your score
- Installing analytics, chat, or advertising scripts without auditing their performance cost
- Ignoring mobile performance while focusing only on desktop Lighthouse scores
- Treating a green Lighthouse score as permanent proof of good performance
A solid performance audit practice covers all of these checkpoints systematically and gives you a repeatable framework for each review cycle.
How do you fix speed regressions when they appear?
Speed regressions are inevitable. The goal is to detect them fast and resolve them before they compound. Waterfall charts in WebPageTest are the most effective diagnostic tool for identifying exactly which resource caused a slowdown.
When a regression appears, check these sources first:
- Third-party scripts. Tag managers, chat widgets, and advertising pixels are the most frequent culprits. Each one adds network requests and JavaScript execution time. Removing unused JS and deferring non-critical scripts directly improves responsiveness.
- JavaScript bloat. A new plugin or library may have added significant unused code. Use Chrome DevTools Coverage tab to identify unused JavaScript and CSS.
- Lazy-load misconfiguration. Applying lazy-load to the hero image or the LCP element delays the most important visual content. Audit your lazy-load attributes after every template or theme change.
- Mobile-specific issues. Desktop scores often mask poor mobile performance. Always test on a throttled mobile connection using WebPageTest's mobile profiles.
Pro Tip: When diagnosing a regression, disable non-essential third-party scripts during your CI audit run. Disabling non-essential scripts during CI runs isolates your own code's performance and prevents external services from skewing your results.
Field data is more authoritative than lab scores for ongoing SEO and UX measurement. A lab score improvement that does not show up in CrUX data within two to four weeks is a signal that the fix did not address the real-world bottleneck. Reopen the investigation rather than moving on.
Checking your speed audit results against conversion data adds a business layer to the technical analysis. A regression that drops your LCP by 500 milliseconds may not look alarming in isolation, but if it correlates with a drop in form completions, the business case for fixing it immediately becomes clear.
Key Takeaways
Ongoing website speed optimization requires a continuous cycle of lab testing, field monitoring, and performance budget enforcement to prevent regressions and maintain real-user performance.
| Point | Details |
|---|---|
| Treat speed as a continuous process | Re-test after every significant change, not just at launch or redesign. |
| Combine lab and field data | Use Lighthouse and WebPageTest for diagnosis; use CrUX and RUM to confirm real-user gains. |
| Enforce performance budgets in CI/CD | Automate build failures when thresholds are breached to catch regressions before production. |
| Prioritize high-impact fixes first | Address images, server response, render-blocking scripts, and fonts before minor tweaks. |
| Monitor INP and Core Web Vitals continuously | Google replaced FID with INP in 2024, making ongoing responsiveness monitoring a ranking requirement. |
Speed optimization is a discipline, not a destination
I have worked with enough sites to say this plainly: the teams that treat speed as a one-time project always end up back at square one within six months. A plugin update, a new marketing script, a seasonal content push. Each one chips away at the gains you worked hard to achieve.
The mindset shift that actually works is treating performance the same way you treat security. You do not patch a vulnerability once and assume you are done forever. You monitor, you set alerts, you review regularly. Speed deserves the same respect.
What I have found particularly valuable is integrating engineering workflows with SEO goals from the start. When your developers understand that a slow LCP score directly costs you search visibility, they stop treating performance budgets as an obstacle and start treating them as a quality standard. That cultural shift is worth more than any single technical fix.
The combination of lab and field testing also prevents a trap I see constantly. Teams celebrate a Lighthouse score improvement, ship the change, and never verify it in CrUX. Two months later, real users are still experiencing the same slow loads because the fix addressed a simulated condition, not the actual bottleneck. Always close the loop with field data.
Finally, assign ownership. Someone on your team needs to be accountable for the monthly audit, the CI/CD budget thresholds, and the regression alerts. Without a named owner, the process drifts. With one, it becomes a habit.
— Ville
How Verkkosivu builds sites that stay fast
Verkkosivu builds every website to load in under one second, and that speed is not just a launch-day achievement. Every site Verkkosivu delivers includes ongoing maintenance with continuous performance monitoring built into the service from day one.

Verkkosivu's approach skips templates entirely. Each site is built to the client's exact specifications, which means no unnecessary code, no bloated plugins, and no performance debt inherited from a generic theme. With more than 100 successful projects and a perfect 5-star rating on Google, the results speak for themselves. If you want a site that performs at launch and keeps performing as your business grows, see what Verkkosivu offers and get started without hidden costs.
FAQ
What is ongoing website speed optimization?
Ongoing website speed optimization is the continuous practice of auditing, fixing, and monitoring your site's load times after every significant change. It prevents performance regressions caused by new content, plugins, and third-party scripts.
How often should I run a website speed audit?
Run a full speed audit at least once per month and after every major update, plugin change, or content push. Teams using CI/CD pipelines should run automated audits on every deployment.
What is the difference between lab data and field data?
Lab data from tools like Lighthouse simulates page loads in controlled conditions for fast diagnosis. Field data from CrUX and RUM captures real user experience and is more authoritative for SEO and UX measurement.
Why did Google replace FID with INP in 2024?
Google replaced First Input Delay (FID) with Interaction to Next Paint (INP) because INP measures responsiveness across all user interactions, not just the first one. This makes it a more accurate signal of real-world page responsiveness.
What causes the most common speed regressions?
Third-party scripts, JavaScript bloat, and lazy-load misconfiguration are the most frequent regression sources. Deferring non-critical scripts and removing unused JavaScript directly improves ongoing site responsiveness.