
Website investment justification is the process of proving the financial and strategic value of a web project within your business plan to secure funding and stakeholder approval. Business owners who treat this as a financial argument, not a technology pitch, win more approvals. The core metrics are net present value (NPV), return on investment (ROI), and payback period. Website costs range from $300 for a basic landing page to over $120,000 for custom web applications, so the scale of your justification must match the scale of your ask. Getting this right is the difference between a business plan that moves forward and one that stalls.
What are the key components needed to justify website investment in a business plan?
A solid website investment justification rests on three pillars: cost transparency, financial modeling, and strategic alignment. Skip any one of these and investors will push back hard.
Cost breakdown
Website costs vary widely based on project scope and platform, and your business plan must reflect that reality with specifics, not estimates. Use this table as a starting framework:
| Project type | Typical cost range | Best for |
|---|---|---|
| Landing page | $300–$3,000 | Lead generation, single product |
| Business website | $1,000–$10,000 | SMBs, service companies |
| Mid-market redesign | $5,000–$15,000 | Growing companies, rebrands |
| Custom web application | $120,000+ | SaaS, complex platforms |
Beyond the build cost, maintenance expenses range from $20 to $800 per month depending on platform and security requirements. That ongoing cost belongs in your operating expense (OPEX) forecast, not buried in a footnote.
Financial planning inputs
Your business plan website investment section needs these financial inputs to hold up under scrutiny:
- Cash flow projections: Monthly revenue impact estimates for at least 36 months
- Discount rate: Reflects the opportunity cost of capital for your stage and risk profile
- Payback period: The month when cumulative returns exceed total investment
- Sensitivity table: NPV outcomes across best, base, and worst conversion scenarios
Strategic prerequisites
Align the website project with a specific business goal before you model anything. That goal might be reducing customer acquisition cost, entering a new market, or replacing a manual sales process. Without that alignment, the financial model floats without an anchor.

Pro Tip: Build your cost breakdown from real vendor quotes, not industry averages. Investors notice when numbers are too round.
How to build a convincing financial model for your website investment
The most common mistake in website financial planning is using simple ROI as the primary metric. Simple ROI divides net profit by cost. It tells you nothing about when returns arrive or what they are worth in today's dollars. NPV corrects for both problems by discounting future cash flows back to the present.
Why NPV beats simple ROI for web projects
Investors at Series A expect a 25%–40% annualized return, which means a corporate weighted average cost of capital (WACC) of 8% is far too low a discount rate for digital infrastructure. Use 25%–40% to reflect actual opportunity cost. A project with a positive NPV at 35% discount is genuinely compelling to growth-stage investors.
A 36-month financial framework is the recommended structure for website ROI, with the first 12 months focused on recouping the initial investment and months 13–36 capturing compounding organic growth. This timeline also matches the period over which SEO rankings and user trust build meaningfully.
Step-by-step financial model assembly
- List all costs: Development, design, platform licensing, content creation, and first-year maintenance
- Estimate baseline revenue: Current monthly revenue attributable to your digital channel
- Model three conversion scenarios: Conservative (5% lift), base (15% lift), and optimistic (30% lift)
- Apply your discount rate: Use 25%–40% for early-stage companies
- Calculate NPV for each scenario: Use a standard NPV formula in Excel or Google Sheets
- Identify the payback month: The first month cumulative discounted cash flow turns positive
- Build a sensitivity table: Show NPV at different discount rates and conversion assumptions
Here is how those scenarios might compare:
| Scenario | Conversion lift | 36-month NPV at 30% discount |
|---|---|---|
| Conservative | 5% | Marginally positive |
| Base | 15% | Clearly positive |
| Optimistic | 30% | Strongly positive |
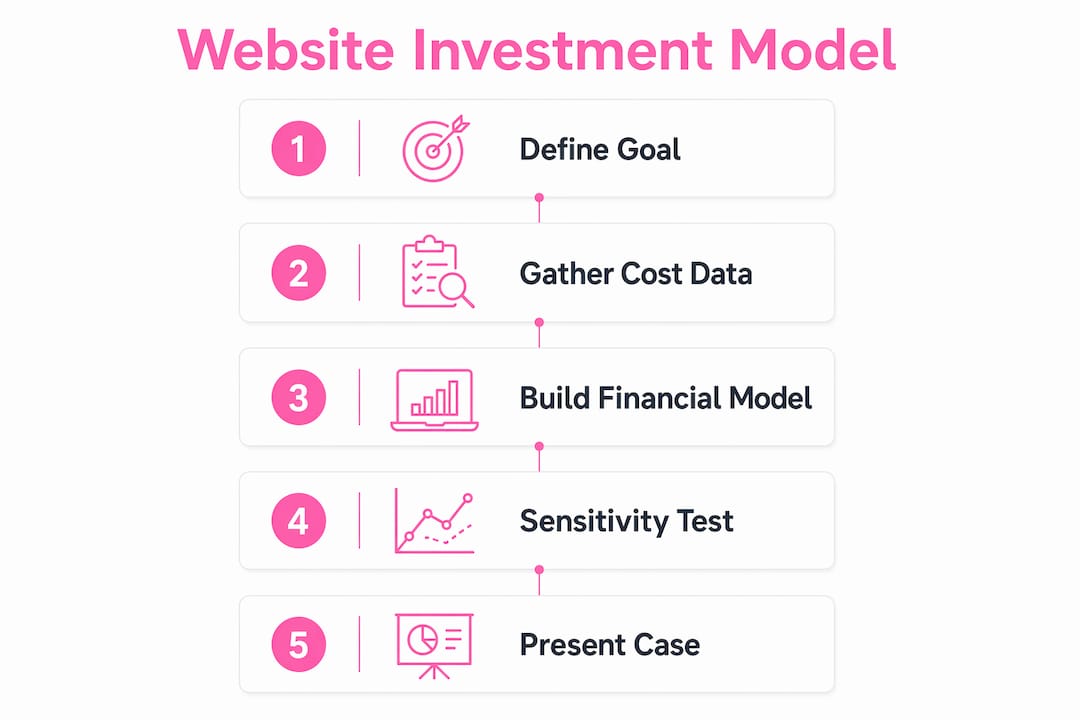
Sensitivity analysis across multiple conversion scenarios reduces investment risk and gives stakeholders confidence that the project holds value even if results come in below expectations. This is the single most persuasive element you can add to a website financial planning section.
Pro Tip: Frame the cost of inaction explicitly. Calculate what a 5% annual decline in organic traffic costs in lost revenue over 36 months. That number often exceeds the website build cost and reframes the conversation entirely.
What qualitative factors strengthen the case for website investment?
Numbers alone rarely close the argument. A comprehensive business plan includes strategic alignment alongside detailed financials to convince stakeholders of project viability. Qualitative factors fill the gap between what the model predicts and what the business actually needs.
Competitive necessity
The cost of inaction includes brand damage, customer loss, and slower growth relative to competitors. If your competitors have faster, better-ranked websites, your absence from page one of search results is a measurable disadvantage. Frame this as a risk, not an aspiration.
Organic search rankings take 12–36 months to compound. Every month you delay the investment is a month your competitors extend their lead. That compounding effect belongs in your qualitative argument, supported by your NPV timeline.
Persuasive qualitative arguments to include
- Brand credibility: A slow or outdated website signals unreliability to first-time visitors
- User trust: Page load speed directly affects bounce rate and conversion probability
- Organic growth trajectory: SEO value compounds over time and reduces paid acquisition costs
- Operational efficiency: A well-built site can automate lead capture, reducing sales labor costs
- Market positioning: Digital presence quality now signals company quality to B2B buyers
You can review a website value indicators checklist to identify which of these factors apply most directly to your business model.
Pro Tip: Pair every qualitative claim with a financial proxy. "Improved user trust" becomes "a 10% reduction in bounce rate, which our model estimates adds $X in monthly revenue." This keeps the argument grounded.
How do you communicate your website investment case to stakeholders?
Investors rely on concise executive summaries with clear financial forecasts and strategic rationale. Your website investment section should not read like a technical spec. It should read like a capital allocation decision with a clear expected return.
Structuring the presentation
Lead with the executive summary: total investment, expected payback period, and NPV at your base scenario. Put the sensitivity table on the same page. Investors scan for risk first. Showing them three scenarios upfront signals that you have stress-tested the numbers.
Follow the summary with the strategic rationale. Explain why the website is necessary for the business goal you identified, not just beneficial. Use language like "required to execute the growth plan" rather than "would be helpful for marketing."
Key performance indicators to track post-launch
Defining KPIs in the business plan itself shows investors you intend to measure results. Include these:
- Organic sessions: Month-over-month growth in unpaid search traffic
- Conversion rate: Percentage of visitors who complete a target action
- Cost per lead: Total marketing spend divided by leads generated
- Page load time: Sub-one-second load times correlate with higher conversion rates
- Revenue per visitor: Total revenue divided by total site visitors
| KPI | Measurement tool | Review frequency |
|---|---|---|
| Organic sessions | Google Search Console | Monthly |
| Conversion rate | Google Analytics | Weekly |
| Page load time | Google PageSpeed Insights | Quarterly |
| Revenue per visitor | CRM or e-commerce platform | Monthly |
For practical guidance on presenting these requirements clearly, the website readiness checklist covers what to prepare before engaging stakeholders or developers.
Key Takeaways
Justifying website investment in a business plan requires NPV modeling, cost transparency, and qualitative risk framing, not just a simple ROI calculation.
| Point | Details |
|---|---|
| Use NPV, not simple ROI | Discount future cash flows at 25%–40% to reflect real opportunity cost for growth-stage companies. |
| Model three scenarios | Show conservative, base, and optimistic conversion lifts to demonstrate stress-tested thinking. |
| Include OPEX in the plan | Monthly maintenance costs of $20–$800 must appear in your operating expense forecast. |
| Quantify the cost of inaction | Calculate lost revenue from declining organic traffic to reframe delay as a financial risk. |
| Lead with an executive summary | Put total investment, payback period, and base NPV on the first page investors see. |
What most business plans get wrong about website justification
I have reviewed dozens of business plans that include website investments, and the pattern is consistent. Entrepreneurs spend three pages on design preferences and two sentences on financial returns. That ratio is exactly backward.
Investors do not care what the site looks like. They care what it earns. The plans that get approved treat the website as a revenue-generating asset and model it accordingly. They show a discount rate, a payback month, and a sensitivity table. The plans that get rejected show a mockup and a single-line cost estimate.
The second mistake is ignoring the cost of inaction entirely. Every month without a functional, fast website is a month of compounding SEO disadvantage. That is a real financial cost, and it belongs in the model. I have seen this single reframe shift investor sentiment from skeptical to supportive in one conversation.
My honest advice: start with a platform that fits your current budget and scales with your growth. Custom builds are powerful, but a well-executed mid-range site often delivers better early returns than an over-engineered one that took six months and $80,000 to launch. Budget realistically, model conservatively, and let the numbers make the case.
— Ville
Verkkosivu builds websites that fit your business plan
Business owners who have done the financial work deserve a development partner who delivers on the numbers.

Verkkosivu specializes in custom websites built without templates, loading in under one second, and delivered often within 48 hours. With more than 100 successful projects and a perfect 5-star rating on Google, Verkkosivu gives you a site that performs from day one. Every project includes SEO optimization, A/B testing, and ongoing maintenance support, so the KPIs you put in your business plan are the ones you can actually track. Visit Verkkosivu.io to see how a professionally built site fits your investment case.
FAQ
What is website investment justification in a business plan?
Website investment justification is the financial and strategic argument that proves a web project will generate returns that exceed its cost. It uses metrics like NPV, ROI, and payback period to satisfy investors and stakeholders.
What discount rate should I use for website ROI modeling?
Use a discount rate of 25%–40% for early-stage and growth-stage companies, as this reflects the actual opportunity cost of capital that Series A investors expect from digital infrastructure projects.
How long should a website ROI projection cover?
A 36-month projection is the recommended standard. The first 12 months focus on recouping the initial investment, and months 13–36 capture compounding organic growth and trust.
What costs belong in a website financial plan?
Include initial development, design, platform licensing, content creation, and monthly maintenance. Maintenance alone ranges from $20 to $800 per month and must appear in your OPEX forecast.
How do I make my website investment case more persuasive?
Combine a sensitivity table showing NPV across three conversion scenarios with a clear cost-of-inaction calculation. Investors engage more readily with concise summaries that show financial forecasts and strategic rationale on the same page.